1. Overview
MA Crossover is one of the most classic and widely adopted trend-following strategies in quantitative trading.
It detects potential trend reversals by observing the crossover between a short-term moving average (MA_SHORT) and a long-term moving average (MA_LONG).
PulseForce enhances this traditional model by introducing:
- Volatility-based threshold adjustments
- Forced take-profit / stop-loss (Force TP/SL)
- Daily trend filtering
- Dynamic capital allocation
- A full HyperOpt parameter space
This makes the strategy simple, explainable, yet significantly more adaptable to modern, fast-changing markets.
2. Background and Historical Evolution
Moving averages were introduced early in the 20th century and remain one of the most fundamental tools in technical analysis.
As computer-based trading emerged, MA crossover became one of the earliest programmatic trend-following algorithms.
During the CTA/trend-following era (1980–2000), MA Crossover stood out as one of the most reliable “trend detectors,” widely used in futures, FX, and index funds.
In modern markets, MA Crossover is still a core building block for:
- High-volatility crypto trend models
- Long-term ETF trend allocation
- High-frequency momentum strategies
- Multi-factor trend signals
- Machine learning feature engineering
3. What Problem Does the Strategy Solve?
MA Crossover fundamentally aims to solve three key challenges:
How to extract meaningful trend direction from noisy data?
Moving averages smooth out fluctuations.How to confirm when a trend reversal actually occurs?
Crossovers are more reliable than single price breakouts.How to stay in a trend for as long as possible?
Signals only occur at crossovers, preventing premature exits.
It is built on the principle of trend persistence—the statistical tendency for price movement to continue.
4. Key Indicators Explained
| Indicator | Meaning |
|---|---|
| MA_SHORT | Fast moving average; represents short-term sentiment |
| MA_LONG | Slow moving average; represents underlying trend direction |
| Golden Cross | MA_SHORT crosses above MA_LONG → Buy |
| Death Cross | MA_SHORT crosses below MA_LONG → Sell |
| Daily Trend | Daily-level trend direction (up / flat / down) |
| Volatility (HL Range) | High–Low average range for dynamic TP/SL tuning |
5. PulseForce Key Signal Examples (Code Snippets)
Below are the essential logic snippets from PulseForce’s built-in ma_crossover strategy
(only core parts shown for clarity).
5.1 Buy Signal (Short MA crosses above Long MA + bullish candle confirmation)
1 | cond = ( |
This ensures:
- A clean Golden Cross
- Confirmation via bullish price action
- Avoiding signals on illiquid or halted candles
- Only triggers on the crossover candle (trend confirmation)
5.2 Sell Signal (Death Cross + Volatility Adjustment + Forced TP/SL)
1 | # Forced SL (overrides all signals) |
Three exit paths:
- Forced TP/SL (highest priority)
- Death Cross–based exit flow
- Volatility-adjusted dynamic TP/SL
5.3 Death Cross Detection (Signal Trigger)
1 | return ( |
Simple, interpretable, and structurally clean.
5.4 Volatility Adjustment (PulseForce Enhancement)
1 | vol = (curr_row["_hl_range"] / curr_row["close"]) |
Benefits:
- Higher volatility → wider thresholds
- Lower volatility → stricter thresholds
- Makes the strategy self-adaptive across assets
6. PulseForce Parameter Visualization & Auto-Optimization
PulseForce provides full visual configuration for backtesting, strategy tuning, and HyperOpt optimization.
Backtest configuration interface: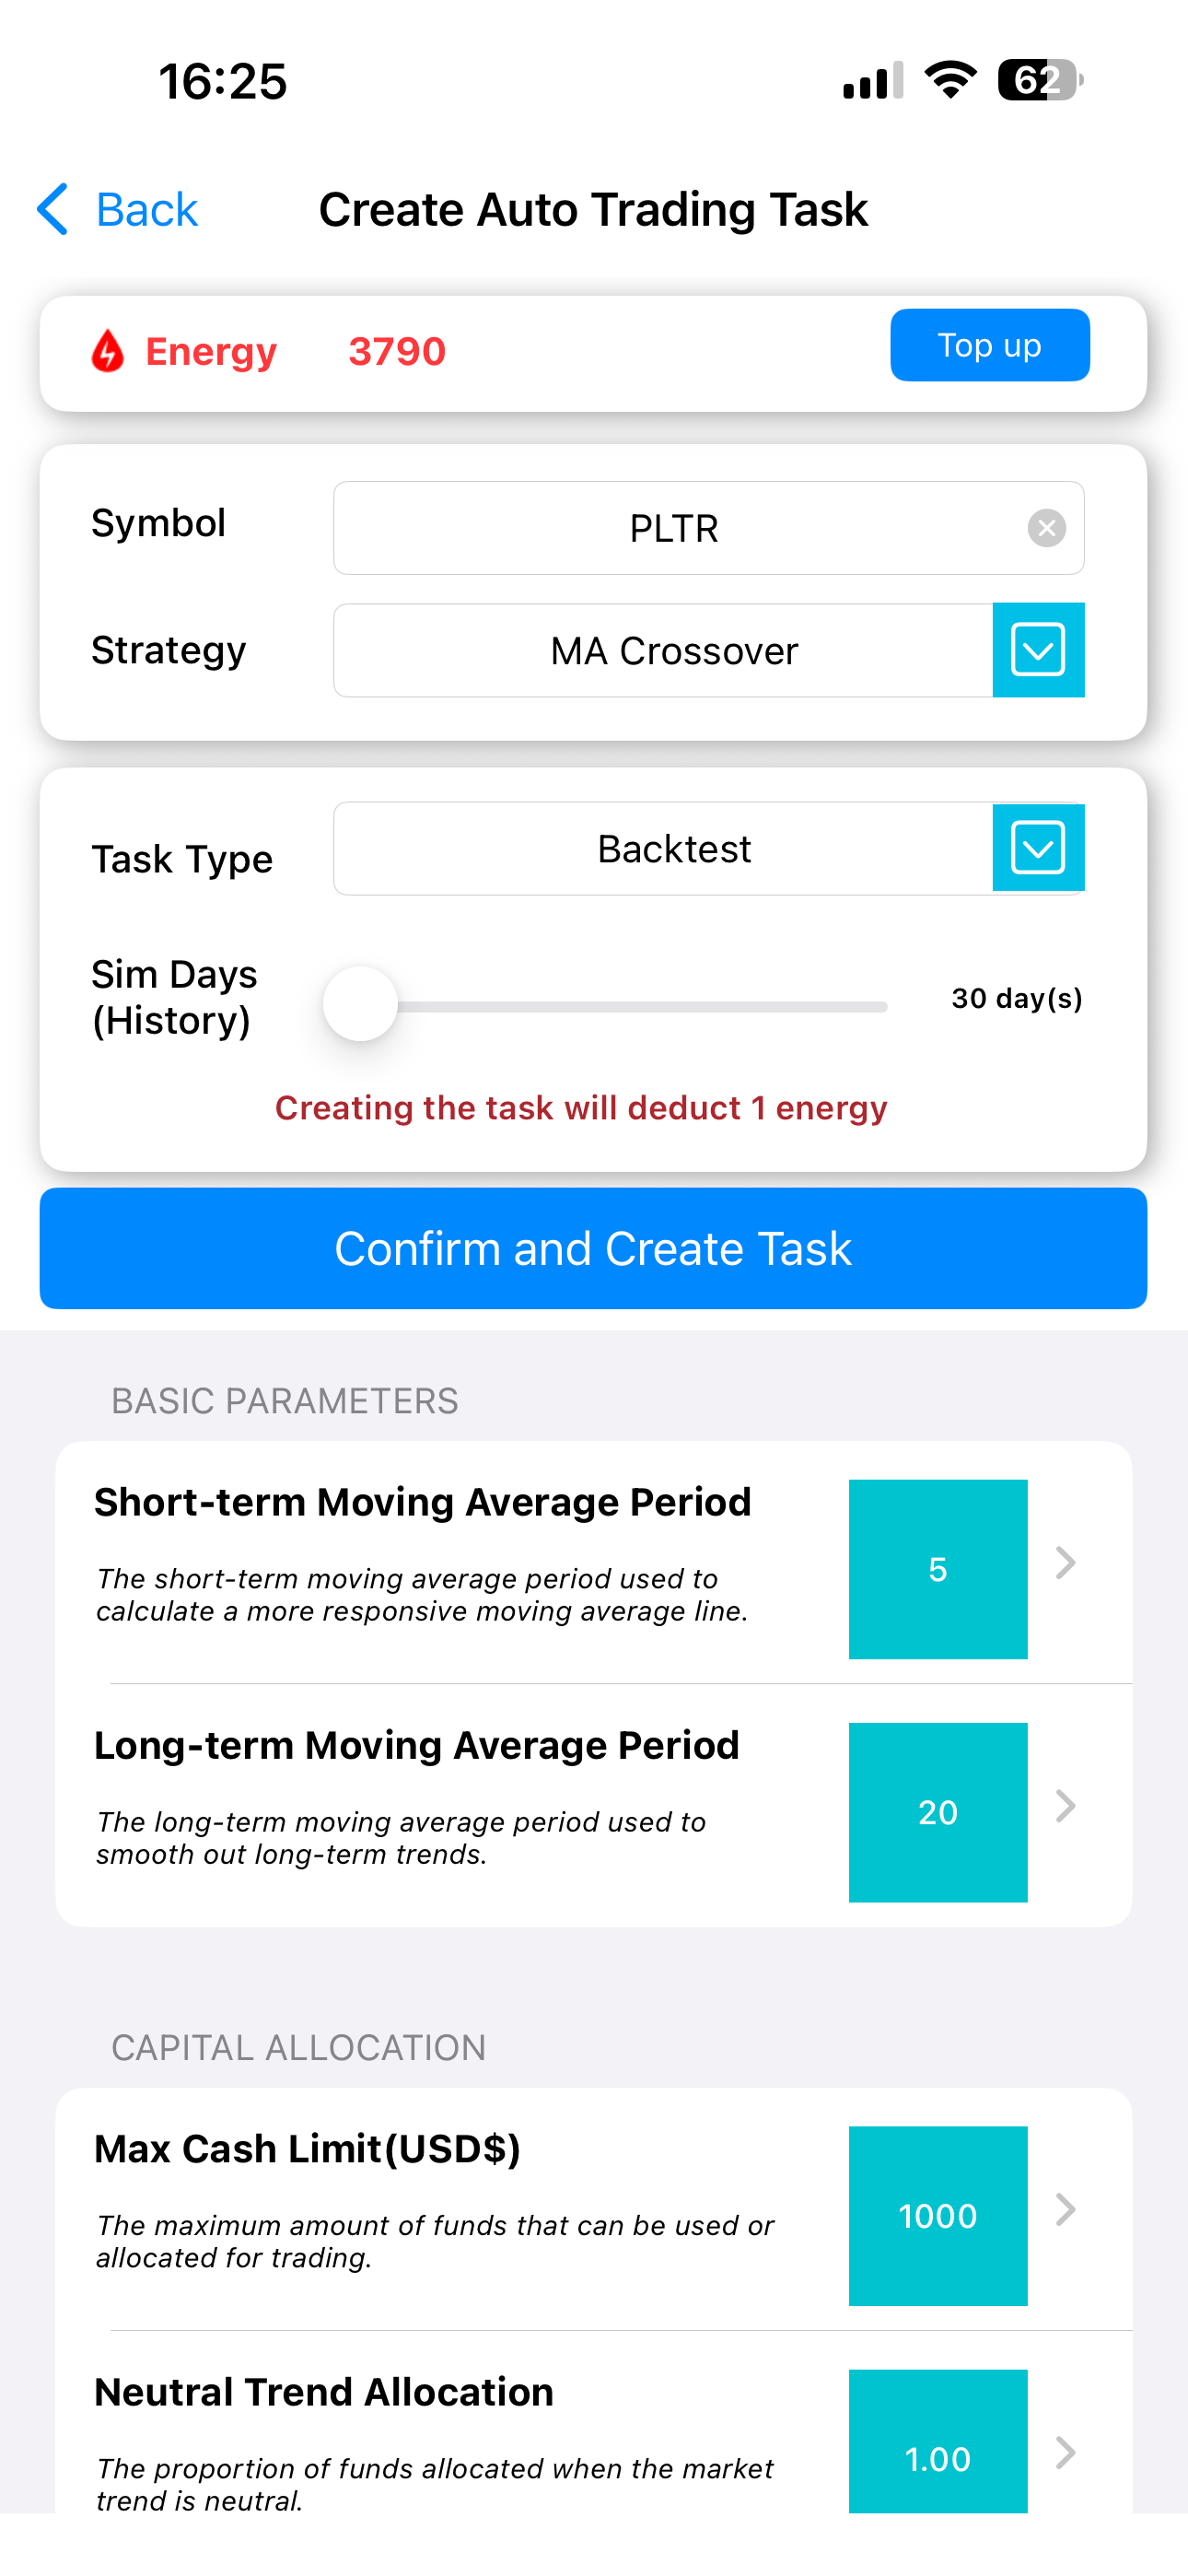
HyperOpt configuration interface: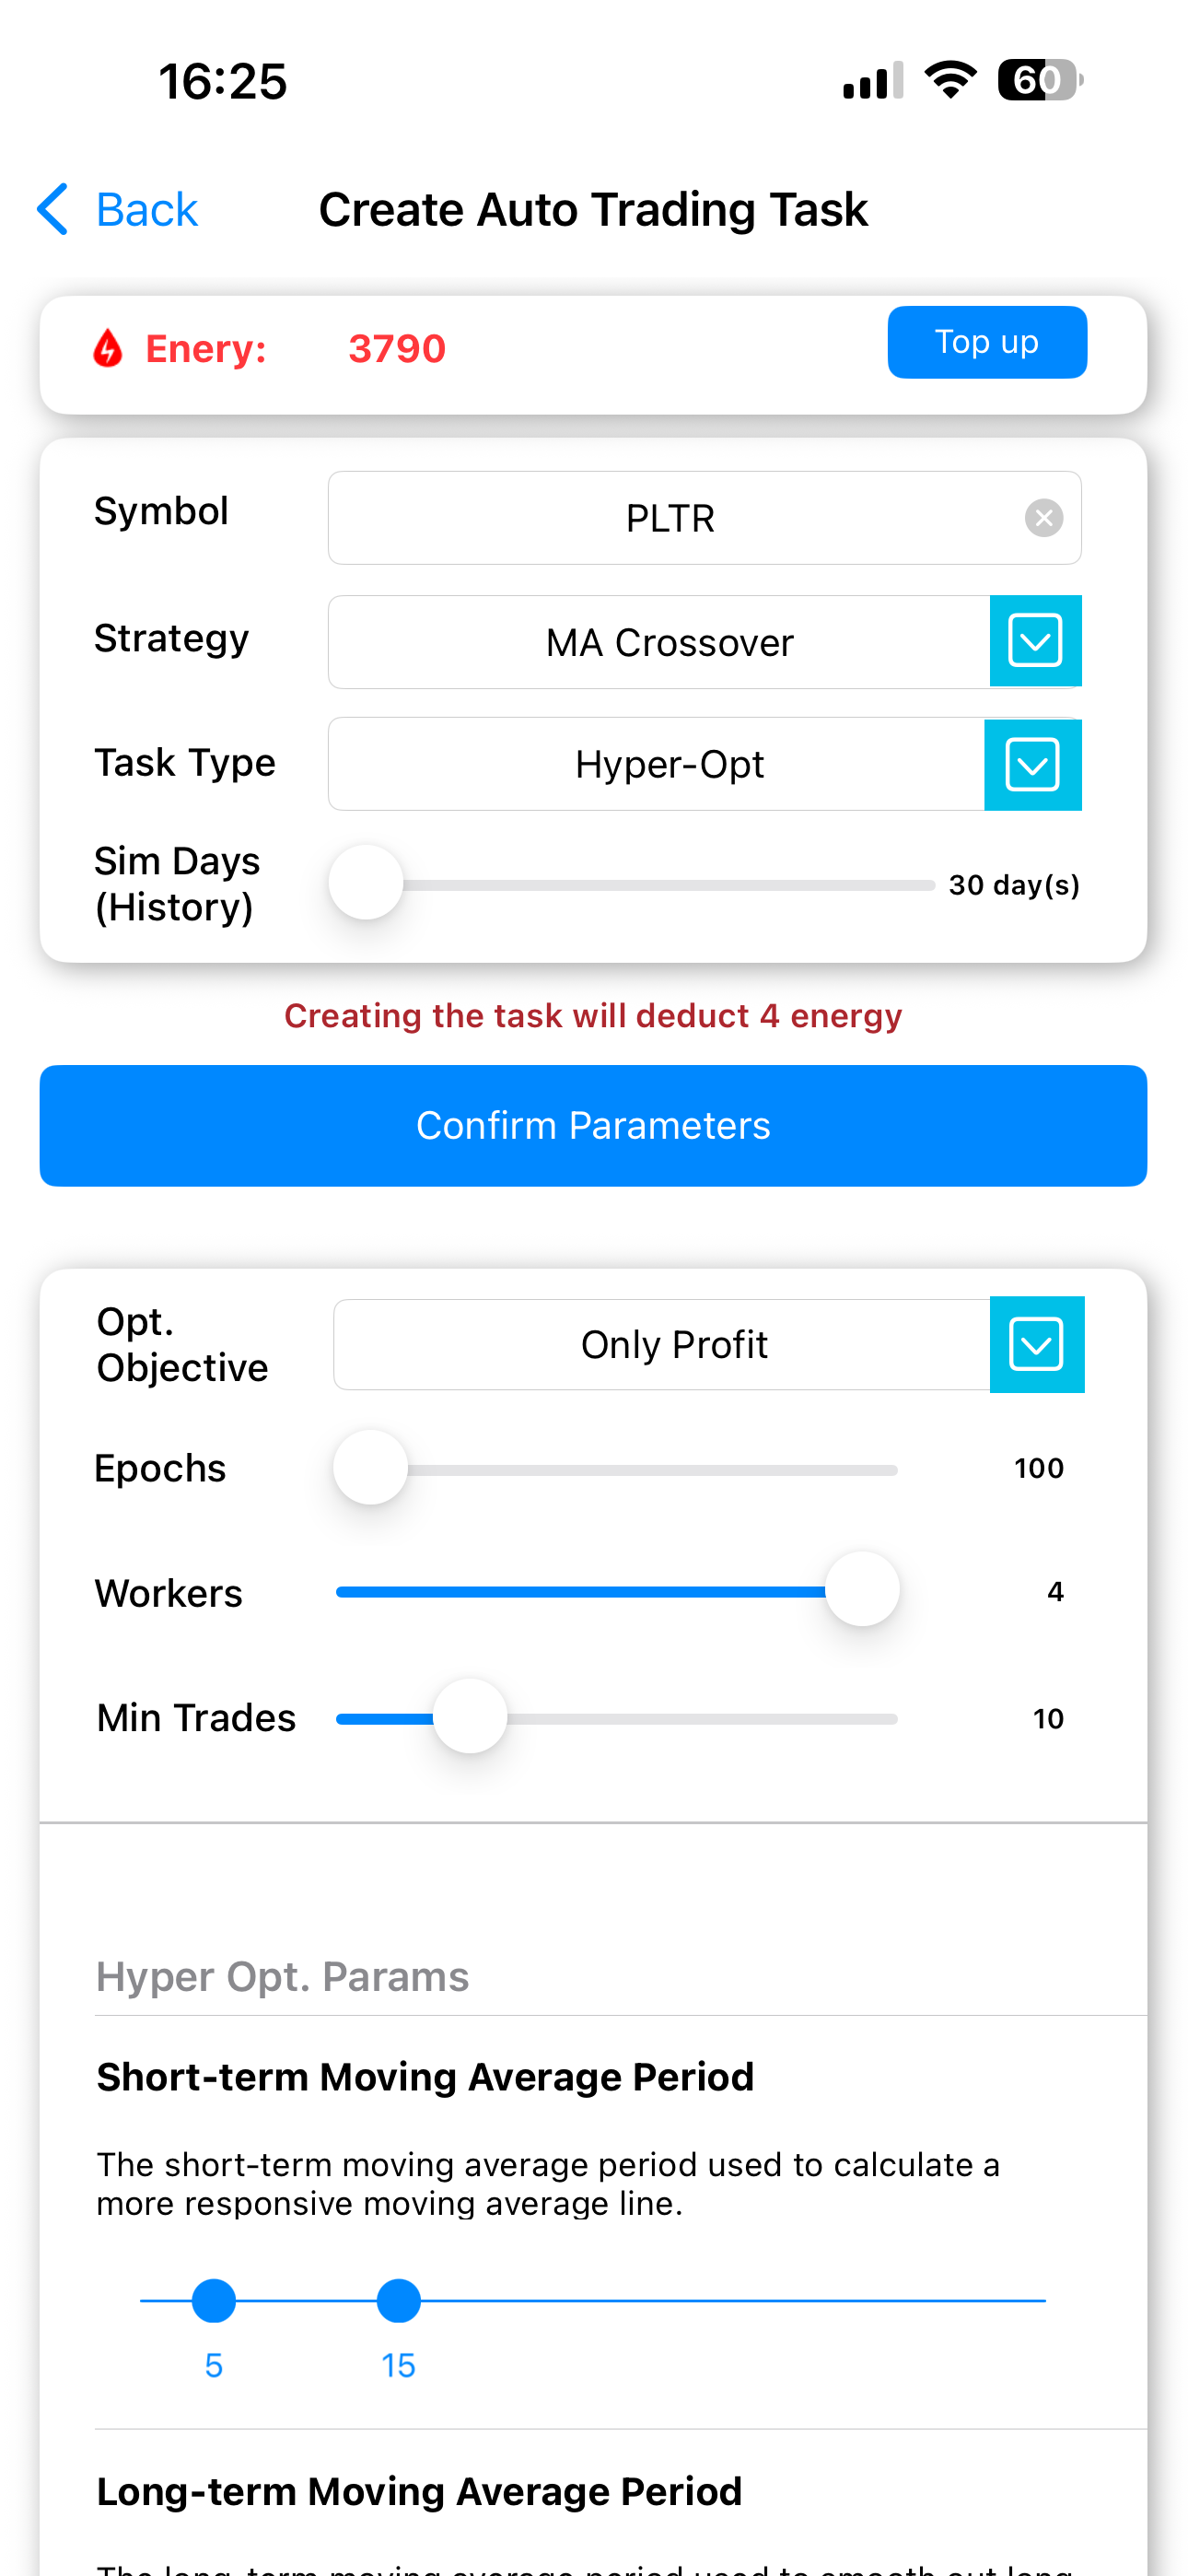
These parameters can be auto-optimized for each asset:
6.1 Trend Parameters (Core Signal Logic)
| Parameter | Meaning | Optimizable |
|---|---|---|
MA_SHORT |
Fast MA period | ✅ |
MA_LONG |
Slow MA period | ✅ |
Typical search ranges:
MA_SHORT: 5–15MA_LONG: 30–60
6.2 Risk Parameters (Fully Optimizable)
| Parameter | Meaning | Optimizable |
|---|---|---|
force_stop_loss |
Hard stop-loss | ✅ |
force_take_profit |
Hard take-profit | ✅ |
daily_stop_loss |
Signal-based SL | ✅ |
daily_take_profit |
Signal-based TP | ✅ |
volatility_ratio |
Volatility influence | ✅ |
6.3 Capital Allocation Parameters
(Manually configurable, not optimized)
| Parameter | Meaning |
|---|---|
max_funds_allowed_using |
Max capital usage |
allowable_funds_uptrend |
Allocation in uptrend |
allowable_funds_downtrend |
Allocation in downtrend |
allowable_funds_neutral |
Allocation in neutral market |
Used to adjust exposure based on trend strength.
7. Suitable Market Conditions
Best suited for:
- High-volatility, trending assets (BTC, ETH, tech stocks)
- Mid- to long-term trend-following
- High-frequency trend detection (1m/5m)
- Systems needing parameter optimization (PulseForce)
Less suitable for:
- Long sideways markets
- Low-volatility or illiquid assets
- Extremely noisy high-frequency environments
8. Advantages and Limitations
Advantages:
- Simple, intuitive, and deeply explainable
- Long-term statistical edge (trend persistence)
- Low parameter sensitivity, ideal for optimization
- Integrates smoothly with volatility and trend filters
Limitations:
- Inherently lagging
- Prone to whipsaw in sideways markets
- Crossovers confirm trends, not predict them
PulseForce’s enhancements greatly mitigate these weaknesses.
9. Summary
MA Crossover remains one of the most time-tested and reliable trend-following models in quantitative trading, valued for its simplicity, clarity, and cross-market robustness.
PulseForce elevates the traditional Golden Cross / Death Cross structure by integrating:
- Volatility-adaptive thresholds
- Forced TP/SL safety mechanisms
- Daily trend filtering
- Dynamic capital allocation
- HyperOpt-powered auto-optimization
Together, these create a more resilient, adaptive, and modern trend-following system suitable for both beginners and advanced traders.
To explore more strategies and features, visit:
👉 PulseForce Official Website — https://pulse.hiforce.ai